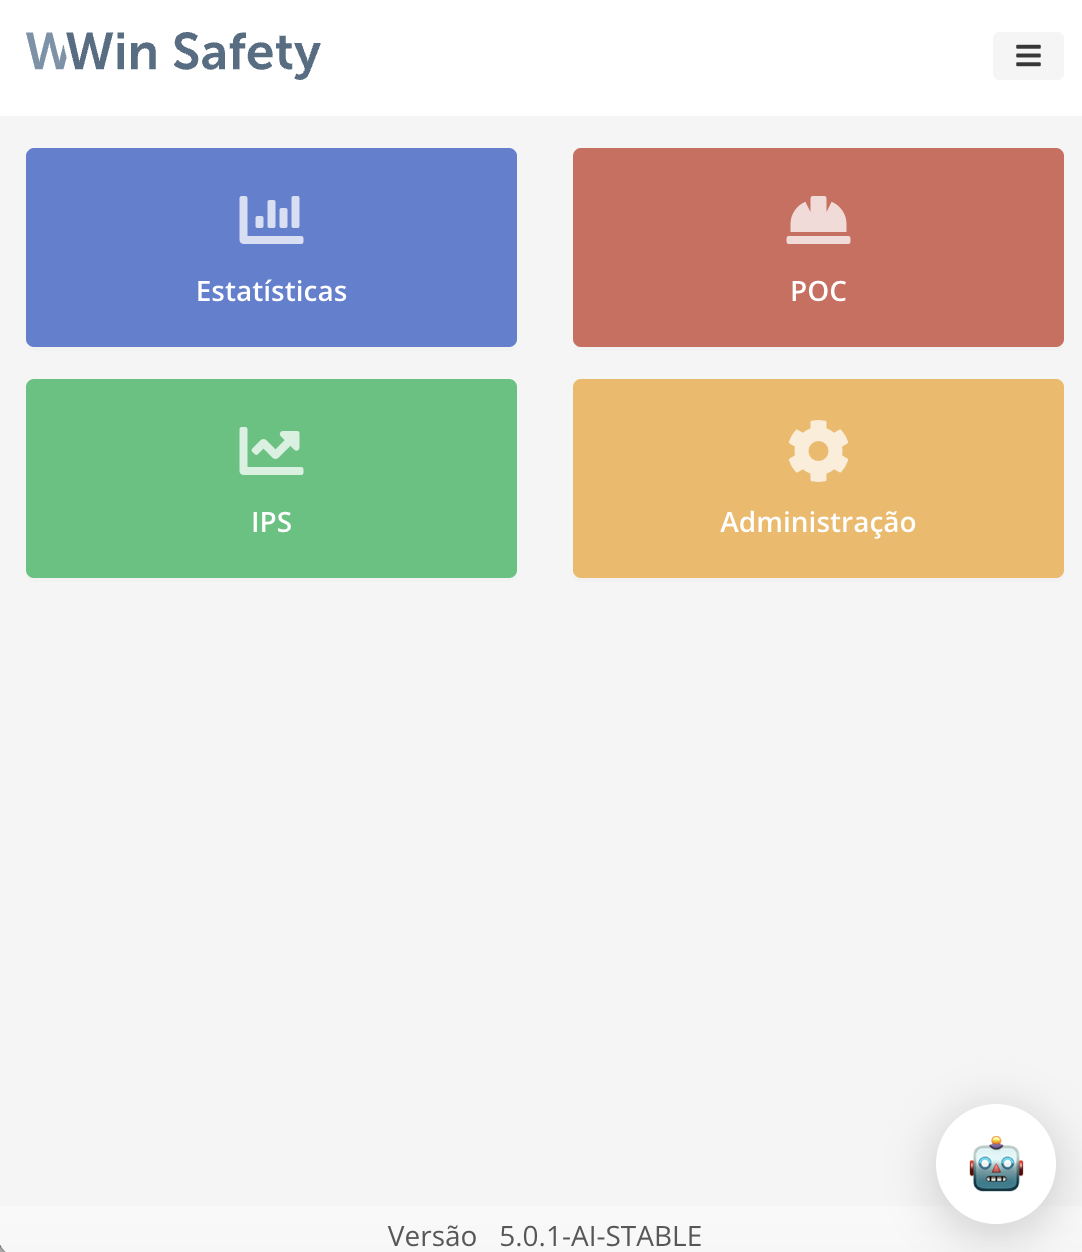
Intelligent Safety Management
Real-time indicators, process automation and artificial intelligence for a safer operation. The WWIN Safety System is the tool that leaders need to make decisions grounded in real data.
Record and analyze behavioral deviations with precision. Obtain trend charts of safe and unsafe practices by area, shift and category. Transform field observations into actionable data for accident prevention.
Assess the degree of adherence to good practices in Occupational Safety and Health. A genuinely proactive indicator that identifies deviations and near-misses before they become real accidents — enabling effective preventive action.
Management panels with performance indicators updated in real time. Visualize trends, compare areas and periods, and make quick, data-driven decisions based on real operational data.
AI assistant for safety data analysis, automatic insight generation and decision-making support for leadership. Identify hidden patterns and anticipate risks with cutting-edge technology.
Data collection directly on the factory floor, even without internet connection. Available for iOS and Android, the app allows observers to record data in real time, automatically syncing when the connection is restored.
Manage multiple units, plants and branches in a single centralized environment. Ideal for industrial groups with operations distributed across different cities, states or countries. Compare performance across sites and standardize processes.
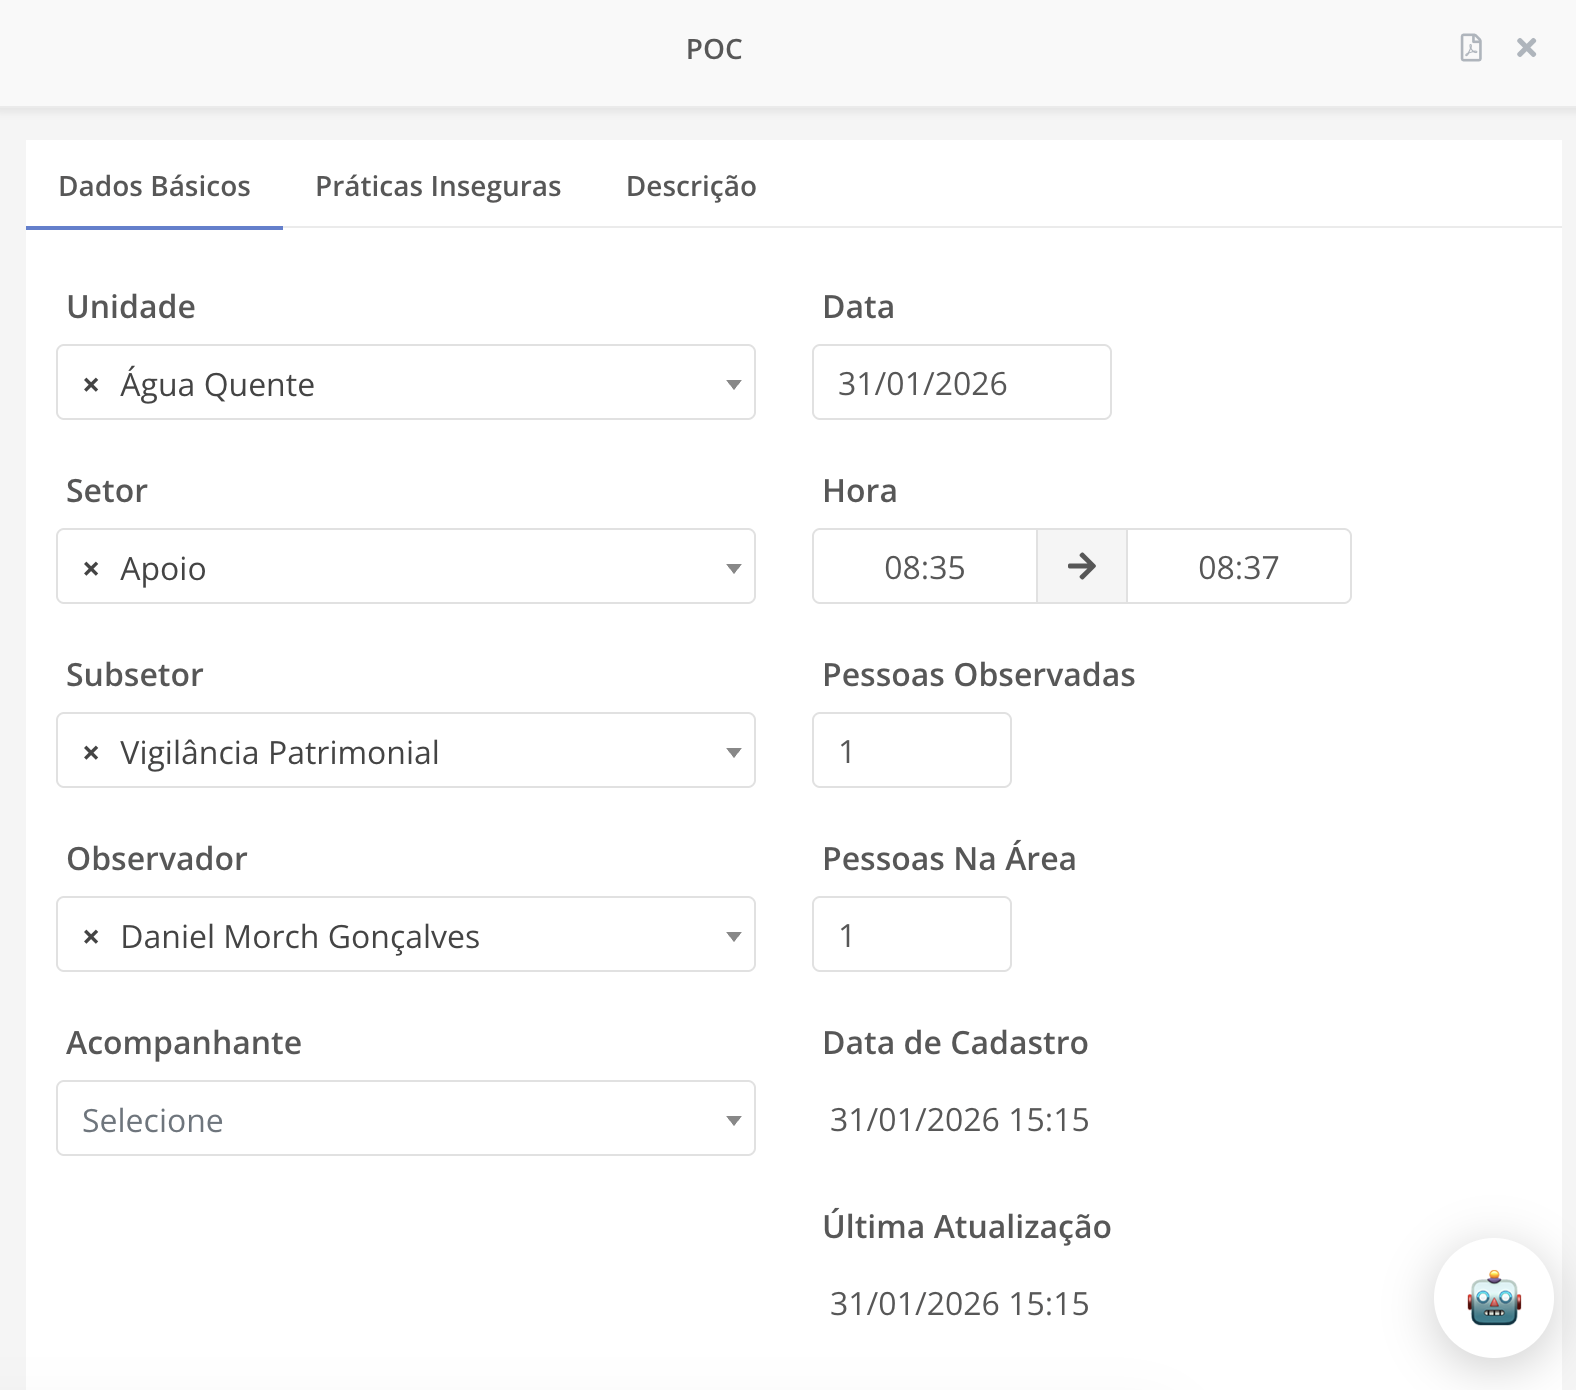
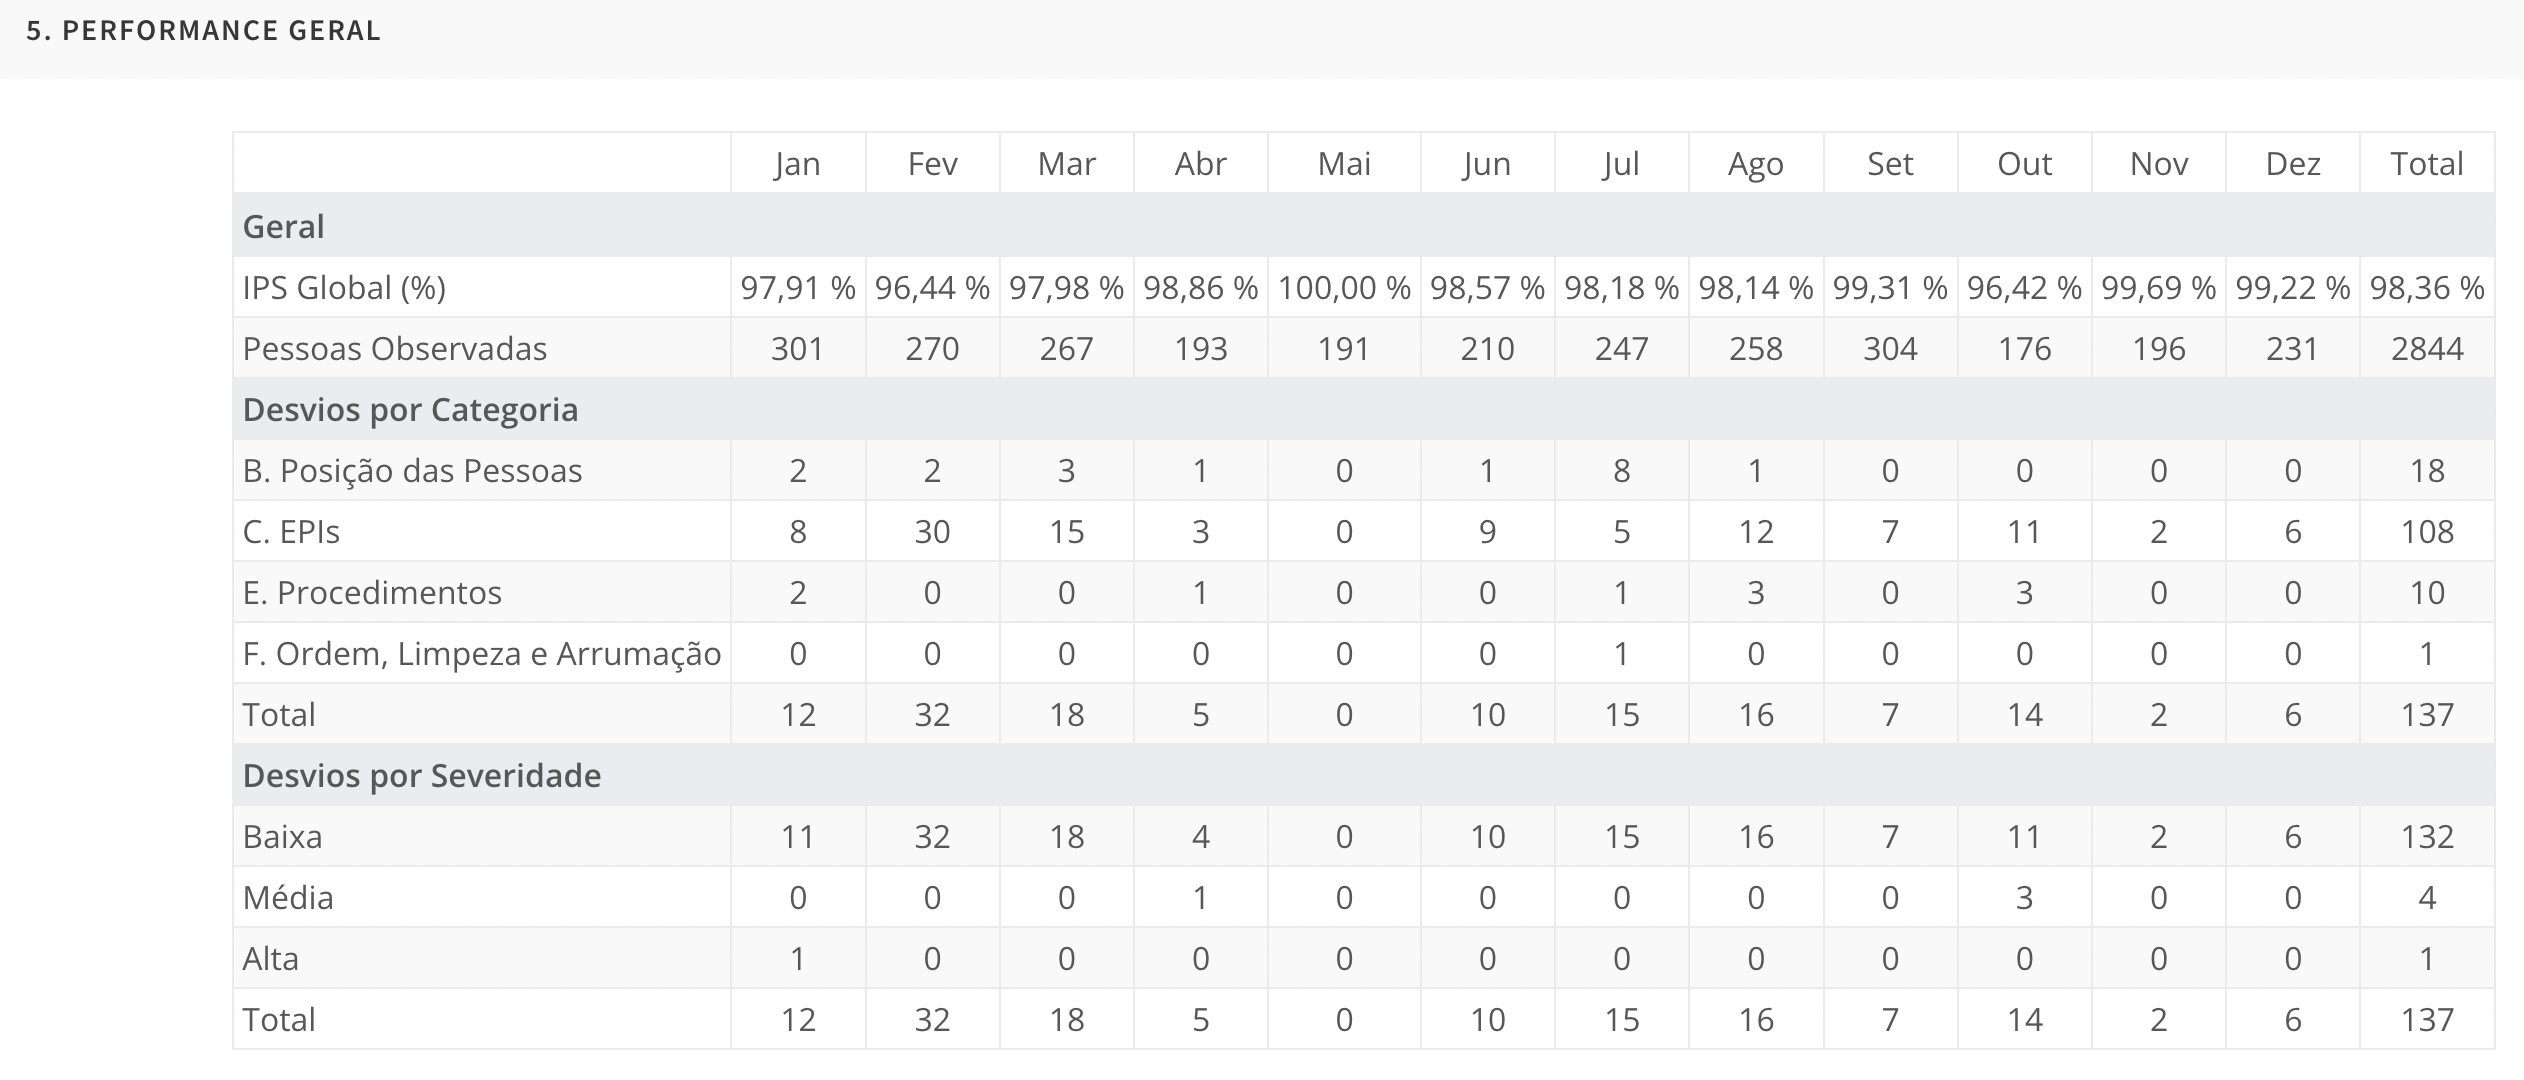
POC Observation Records — Structured data collection by Unit, Sector and Sub-sector
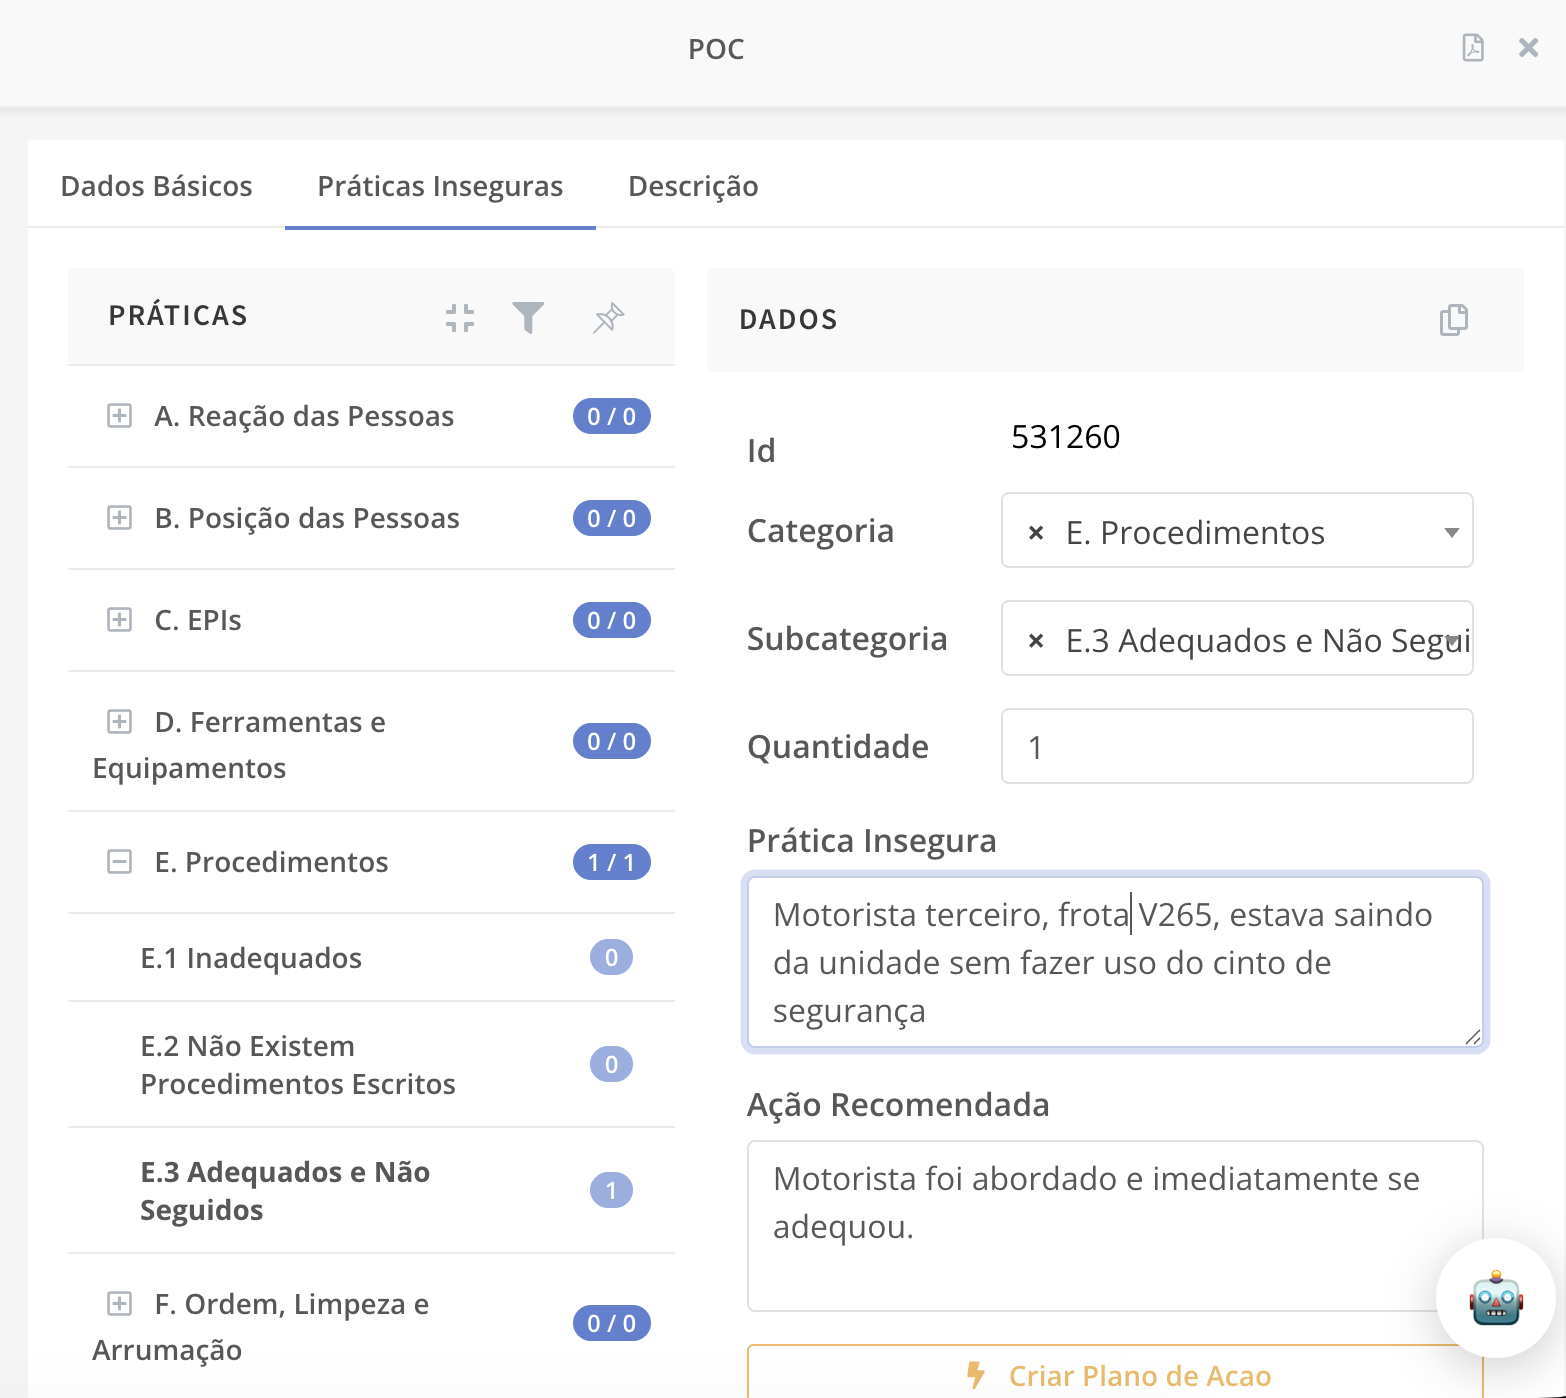
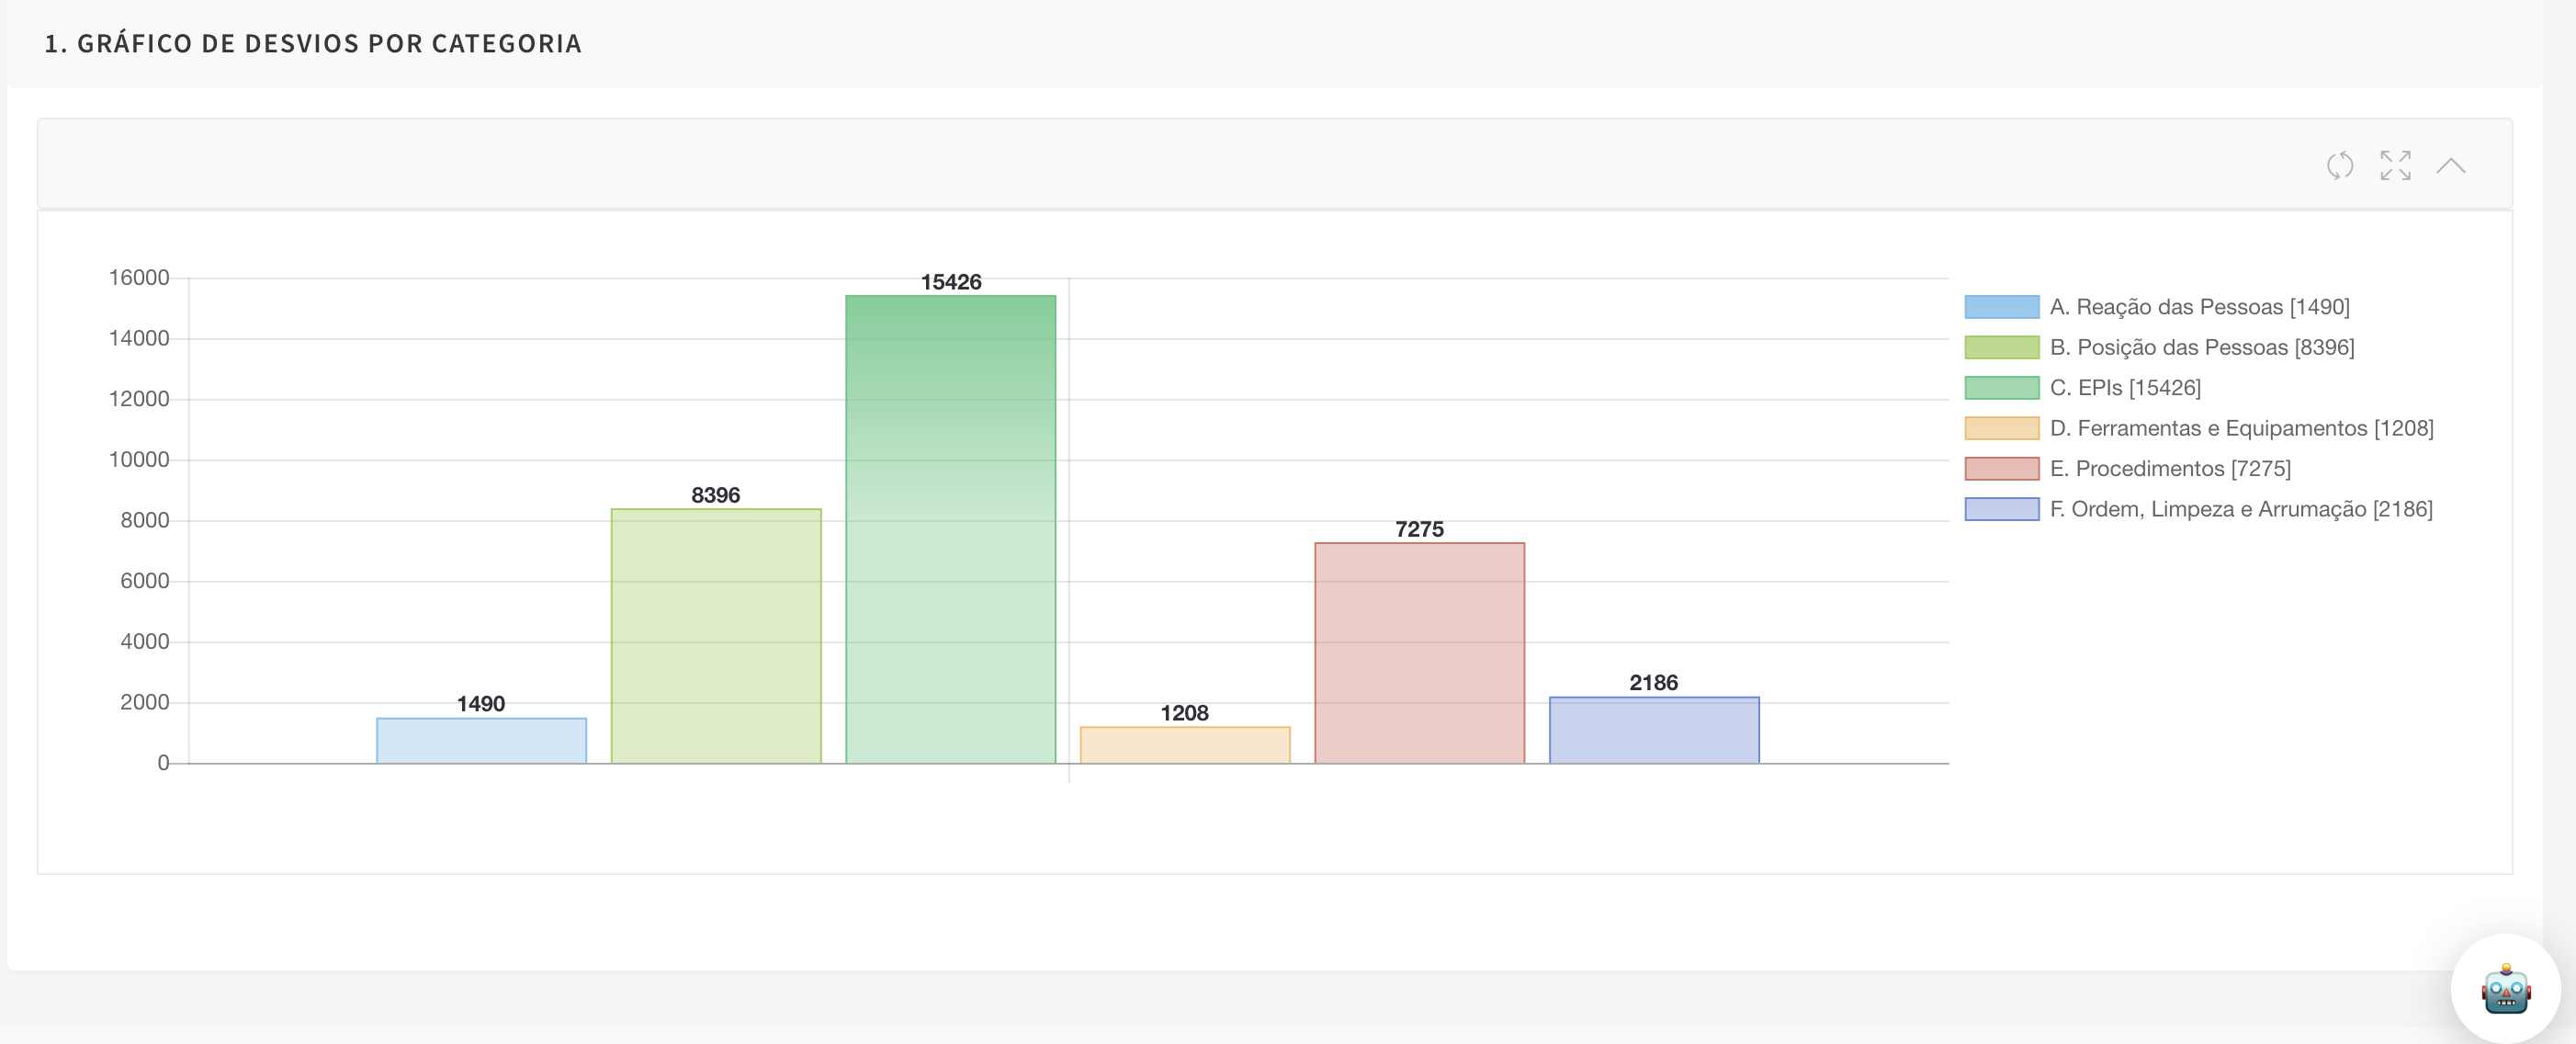
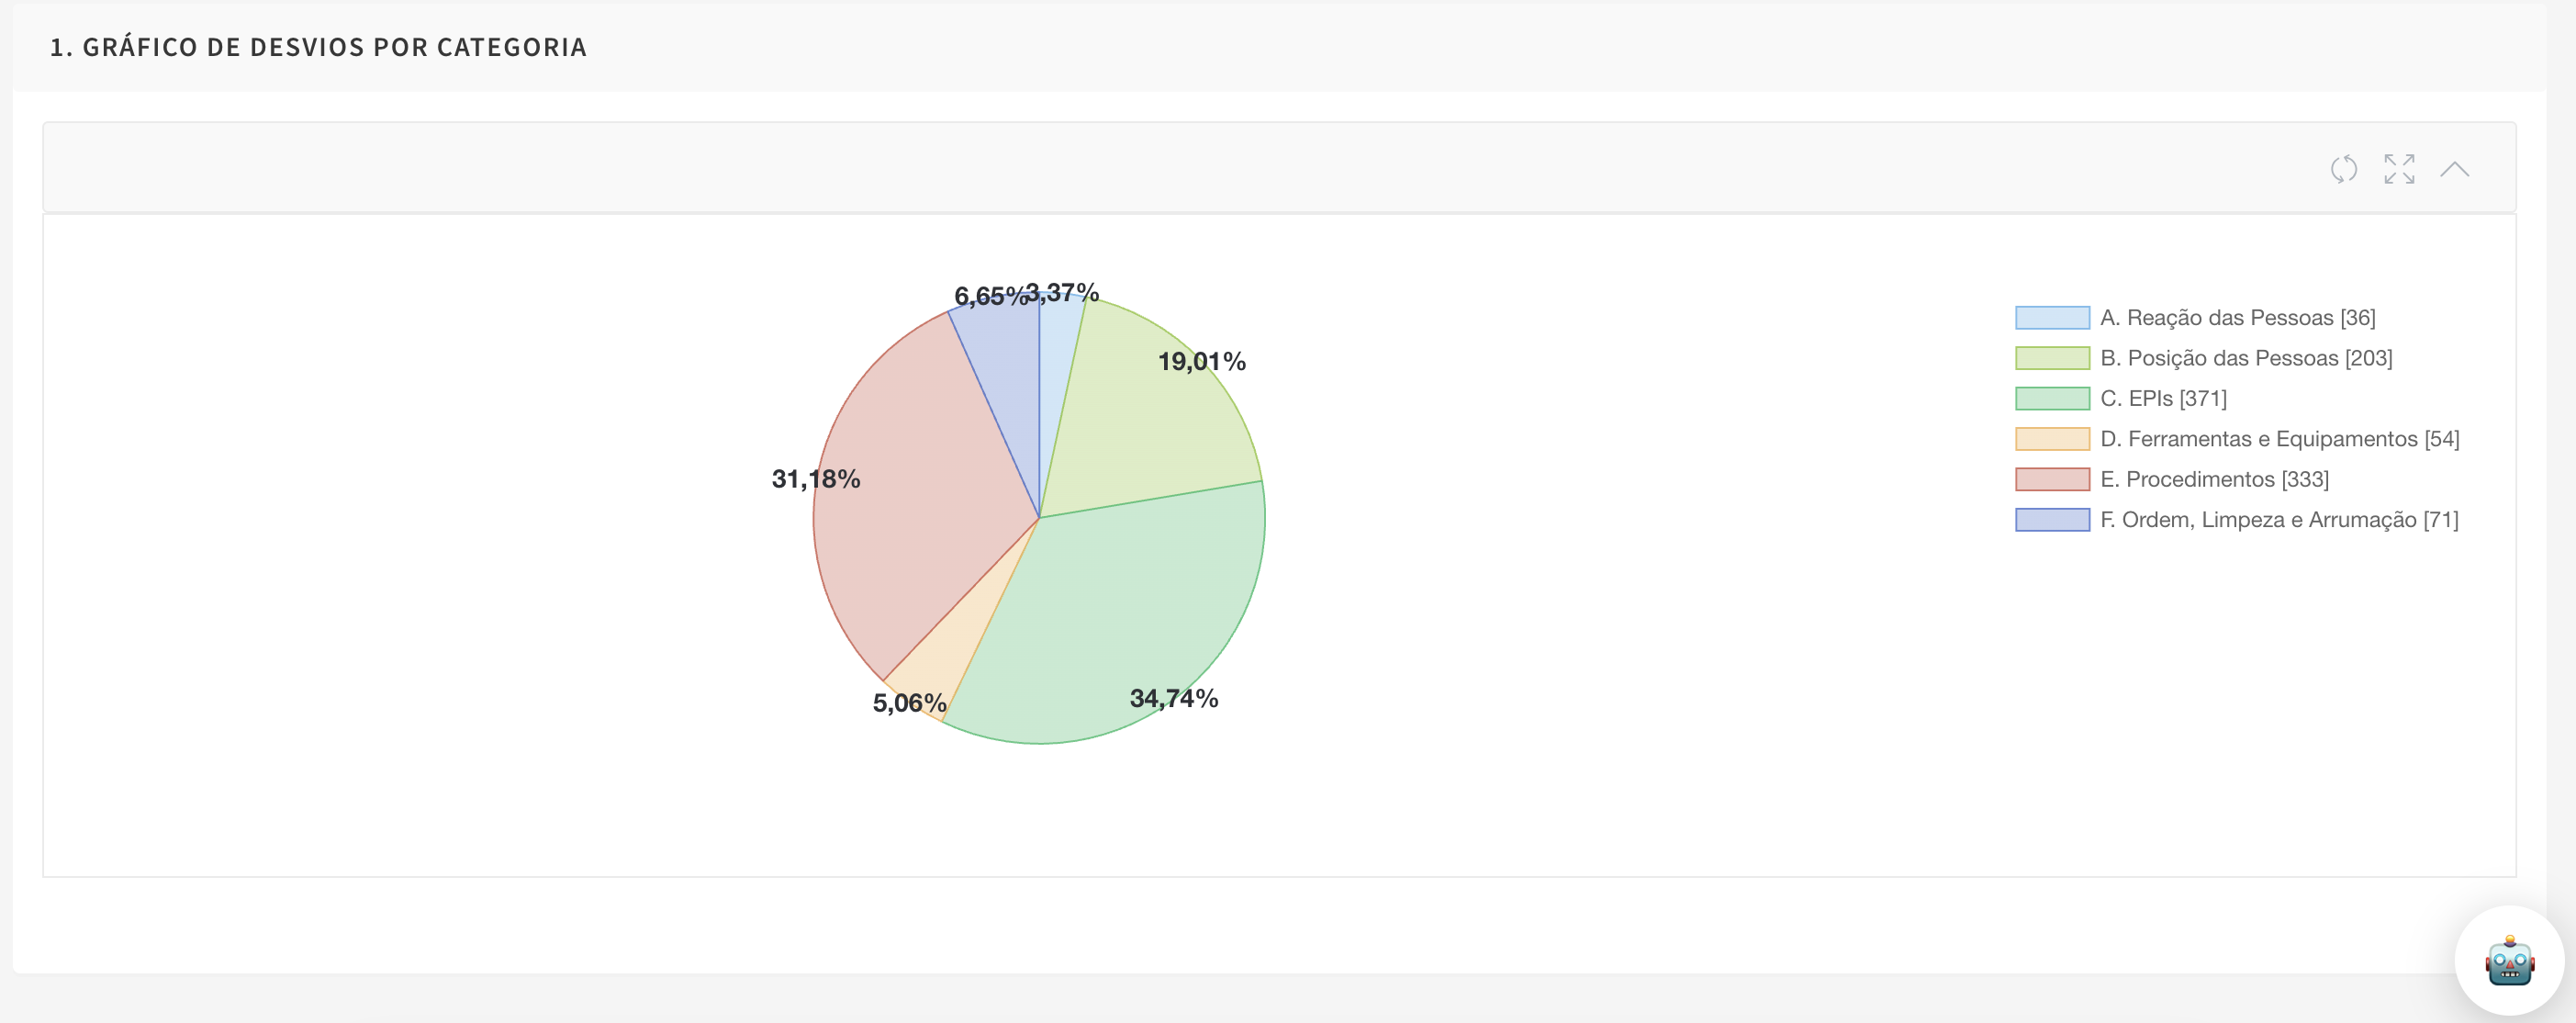
Unsafe Practices Classification — Detailed categorization with Recommended Action
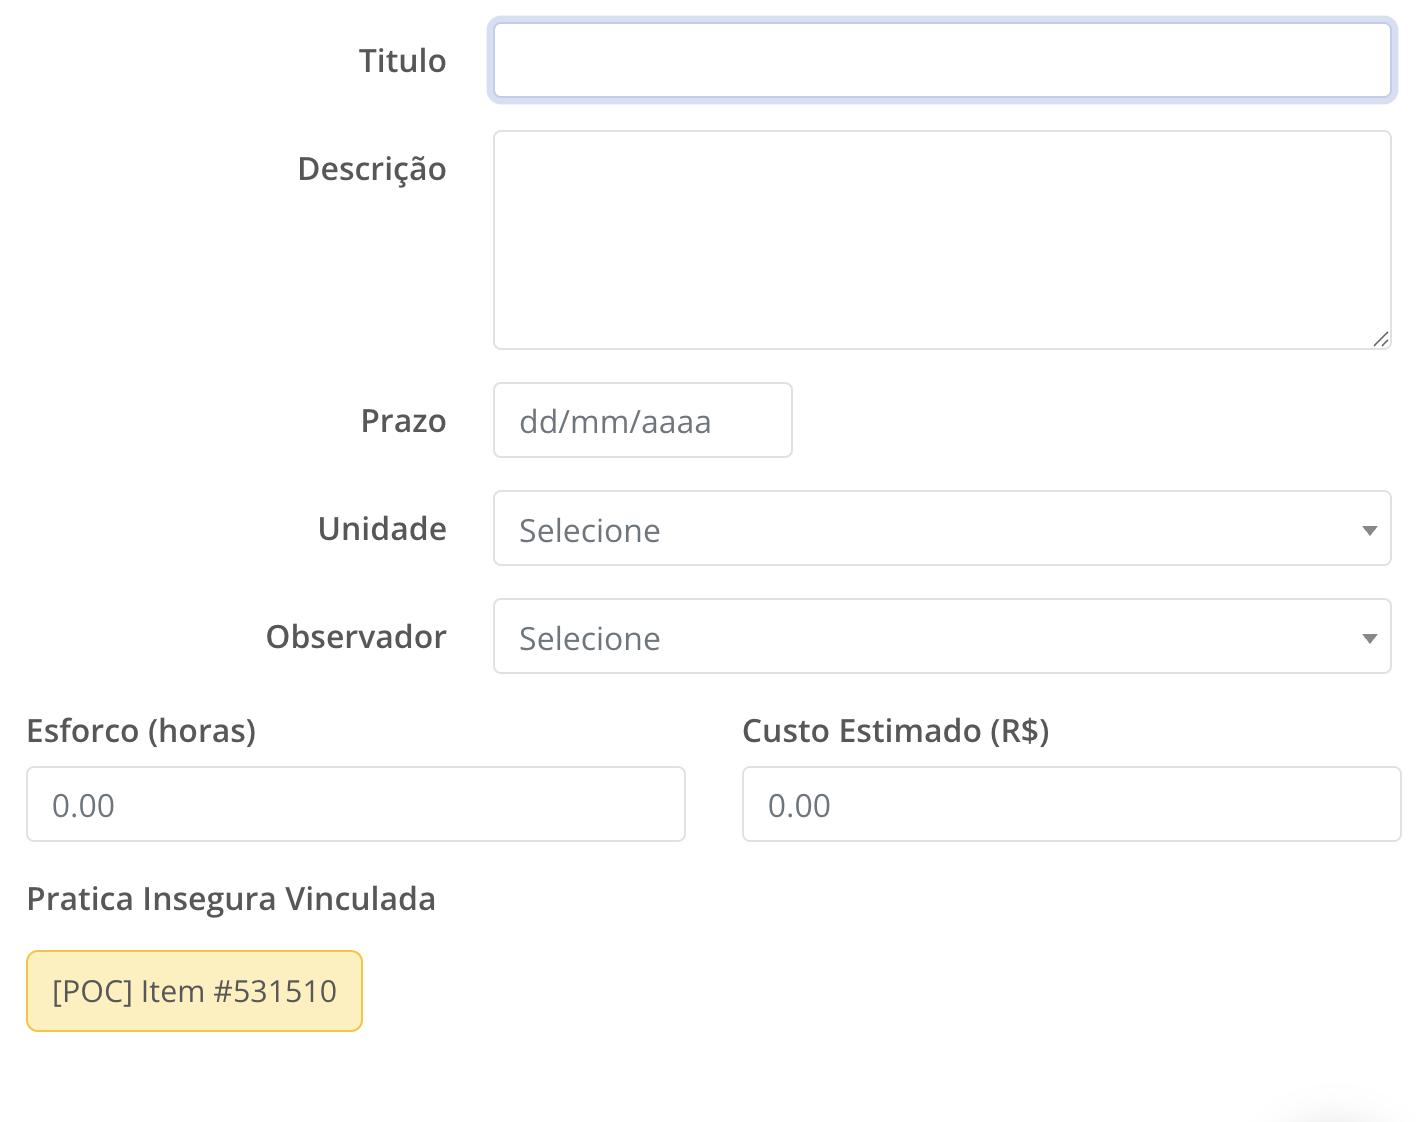
Action Plans — Directly linked to the identified unsafe practice
The WWIN Safety System goes beyond incident logging. It offers a complete analytical platform for strategic safety management, with interactive charts, goal tracking and trend analysis.
Visualize deviation trends by category, observation goal tracking, IPS performance by unit/sector and much more. Multiple chart types (bar, pie, trend line).
Complete API available for all system indicators and charts. Integrate with your corporate dashboards, BI tools and existing management systems.
Export raw data for analysis in Power BI, Tableau, Qlik or any other tool. Total flexibility to create your own dashboards.
Overall IPS Performance — Monthly tracking by deviation category and severity
Deviations by Category Chart — Identify patterns and focus efforts
Percentage Distribution — Proportional view of deviations for action prioritization
Take data collection to where safety happens: the factory floor.
Data is automatically synced as soon as the connection is restored, ensuring that no information is lost.
See firsthand how the WWIN Safety System can transform your company's safety management.
REQUEST DEMO